Evidence for Global Warming
by Larry Vardiman, Ph.D. *
Introduction
The global warming issue will not go away. Evidence continues to mount that some type of warming is occurring, maybe temporarily or of longer duration. But, is it caused by man and can anything be done about it? Environmental activism to reduce carbon dioxide emissions has reached a new intensity. The U.S. Supreme Court is being asked to rule on a suit which demands that the Environmental Protection Agency regulate the release of carbon dioxide as part of its air pollution responsibility. The president is being heavily lobbied to subscribe to the Kyoto Protocol which would require the U.S. to emit less carbon dioxide than it released in 1990. A book and a movie with the titles,
An Inconvenient Truth, which press the case for global warming were released during 2006 by Al Gore, former vice president of the United States.
1,2 He makes the case that man's actions in burning fossil fuels are projected to increase the concentration of carbon dioxide in the atmosphere to the highest levels in history. He insists that uncontrolled releases of carbon dioxide will eventually melt the polar caps completely, raising sea level and inundating many coastal communities like New York, Miami, New Orleans, and Los Angeles; and drastically changing agricultural patterns because of redistribution of temperature and precipitation. And finally, on February 2, 2007, the Fourth IPCC Assessment Report on global warming was released. Interestingly, the report reduced the alarmist rhetoric because climate modelers found that they had overestimated the rise in global temperature and observations did not support the predictions.
Measures of Global Warming
For many years I have been a skeptic of global warming because the climate record available to assess the effects of increased carbon dioxide emission has been too short to say with confidence that the effect is real. There is no question that the concentration of carbon dioxide shown in Figure 1 has been increasing exponentially for almost 50 years now. These data were collected by C. C. Keeling of the Scripps Institute of Oceanography at the Mauna Loa Observatory, Hawaii.
3
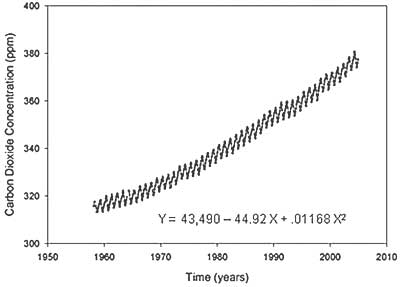
Fig. 1. Atmospheric Carbon Dioxide Concentration.
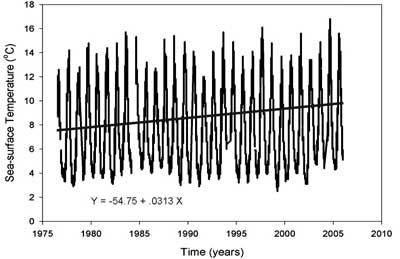
Fig. 2. Sea-surface Temperature.
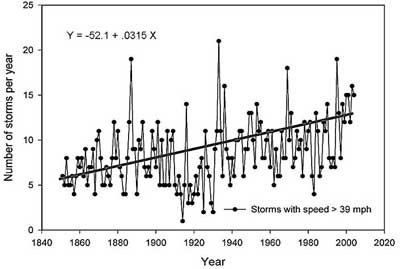
Fig. 3. Frequency of Hurricanes.
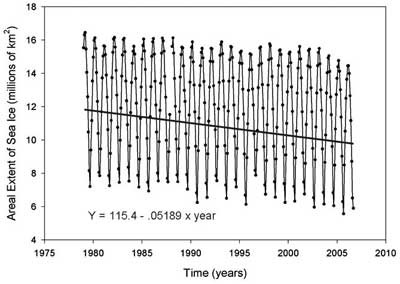
Fig. 4. Extent of Sea Ice.
However, it is still unclear if the conclusions are valid that this increase in carbon dioxide is due to man's burning of fossil fuels and that it is causing the apparent recent warming trend which is melting the polar caps. Several questions continue to nag researchers in the climate community. Is the globe really warming? Are the polar caps really melting? How much of the increase in carbon dioxide is due to man's influence? If man were to attempt to reduce carbon dioxide emissions would it actually do any good? And finally, are there any other possible explanations for the apparent global warming? These are not simple questions and it will require a much longer period of record to be confident in any conclusions.
In order to answer the first two questions, massive amounts of global data must be averaged over a relatively long period of time. And because the effects of global warming are so small compared to the global average, great care must be taken to avoid bias in collection and analysis of the data. Many pitfalls in this process have already occurred which have produced a lack of confidence in the results.
I determined to take another look at the evidence and see if I could detect any recent trends in the atmosphere, ocean, and cryosphere which would seem to support the concept of global warming, choosing to select several small data sets. The data sets I used are limited in spatial and temporal scope making them relatively easy to analyze without bias. However, the results need to be qualified because they don't necessarily reflect long-term, global trends.
The three data sets I analyzed were (1) the sea-surface temperature in the Gulf of Alaska,
4 (2) the frequency of hurricanes in the southeastern Atlantic and Caribbean,
5 and (3) the polar extent of sea ice in the Arctic Ocean.
6
Analysis
If global warming is occurring then sea-surface temperature should also be increasing, hurricane frequency should be on the rise, and polar sea ice should be melting. Figures 2-4 show that the trends for all three processes seem to be consistent for at least the short term. Sea-surface temperature in the Gulf of Alaska has increased about 3% over the past 30 years. Hurricane frequency in the western Atlantic appears to have increased about 3% over the past 150 years. And, the Arctic sea-ice extent has decreased about 5% over the past 25 years. Note, within the general trends, however, shorter period oscillations occur. Hurricane frequency is the most variable, with 30-40 year periods of lower and higher frequency. This has become particularly noticeable since about 1995 when a sudden increase in the frequency of hurricanes hitting the southeastern U.S. followed a 30-year period of lower hurricane frequency. These shorter period oscillations are normal in most geophysical phenomena and are evident in the sea-surface temperature and Arctic sea-ice extent as well, although with less fluctuation.
Based on these limited observations, it appears likely that global warming seems to be occurring over at least the past 30-50 years. I would be quick to add, however, that because of the limited spatial coverage and short time period of these data, it is still not possible to say if these trends will continue. There may be even longer-period fluctuations which we don't yet see in the data. When long-period records of data are plotted, oscillations for many periods are often seen.
These data do not address the question about man's part in causing the warming trend. It is true that increased carbon dioxide concentration in the atmosphere would be expected to increase the greenhouse effect and possibly cause warming. It is unclear whether global warming is due to increased carbon dioxide concentration or if carbon dioxide concentration is the result of global warming. The oceans contain thousands of times more carbon dioxide than the atmosphere and can release significant quantities of carbon dioxide if they are warmed or the pH altered. If some, as yet, undiscovered process is warming the ocean, it could initiate the release of carbon dioxide from the ocean to the atmosphere which, in turn, is warmed even more by radiational heating.
One possible scenario may be found in a recent series of articles by Henrik Svensmark and Nigel Marsh, cosmic ray specialists from Denmark, who have shown an indirect connection between galactic cosmic ray (GCR) intensity and global temperature.
7,8,9 They are studying the influence of the Sun on the flow of GCR to Earth. The Sun's changing sunspot activity influences the magnetosphere surrounding the Earth permitting more GCR to strike the Earth during high periods of activity. When the Sun is active, the intensity of GCR striking the Earth is increased, causing more ionization in the atmosphere, creating more carbon-14, and possibly creating more cloud condensation nuclei (CCN). This increase in CCN, in turn, appears to create more low-level clouds which cool the Earth. When the Sun is quiet the GCR intensity striking the Earth is reduced, allowing the Earth to warm. Svensmark and Marsh have shown a striking statistical correlation between sunspot activity and global cooling and warming over the past 1000 years. The recent rise in global temperature may partially be due to current low solar activity supplemented by a recent increase in carbon dioxide concentration measured at Mauna Loa. The connection which still needs further study is the production of CCN and clouds by GCR.
Conclusions and Recommendations
So, what can we conclude? I believe it is safe to say that:
Global warming appears to have been occurring for the last 30-50 years.
This warming may only be a short-term fluctuation but could be a longer-term trend.
Evidence is still inconclusive whether man is causing the warming.
No "natural" causes for global warming have been confirmed.
One possible new theory is that galactic cosmic radiation (GCR) modulated by solar activity affects low-level cloud cover and is causing the warming.
Global warming may affect some parts of our society negatively but would likely benefit others. In fact, the current warming trend may be returning our global climate closer to that prevalent in the Garden of Eden. Compared to climate changes which have occurred in earth history, a temperature rise of a few degrees is a small fluctuation which will not lead to a complete melting of the polar caps or another ice age. Earth has a stable environmental system with many built-in feedback systems to maintain a uniform climate. It was designed by God and has only been dramatically upset by catastrophic events like the Genesis Flood. Catastrophic climate change will occur again in the future, but only by God's intervention in a sudden, violent conflagration of planet Earth in the end times (II Peter 3:1-12).
 CTD stands for Conductivity, Temperature, and Depth recorder. It is an electronic instrument that continuously records the salinity (by measuring conductivity), temperature, and depth (by measuring pressure) as the instrument is lowered on a hydrowire from a ship. The temperature is instantly recorded from the surface to depth, and gives a profile of temperature and how it changes throughout the water column. (Return to top)Salinity Salinity refers to the saltiness of the water. Salinity (along with temperature) affects the density and thus stability of the water column. This in turn profoundly affects many biological processes in the upper ocean. Saltier water is more dense and thus tends to sink below fresher water. Oceanographers can identify where a water mass comes from just by noting its salt content and temperature. CTD. CTD stands for Conductivity, Temperature, and Depth recorder. It is an electronic instrument that continuously records the salinity (by measuring conductivity), temperature, and depth (by measuring pressure) as the instrument is lowered on a hydrowire from a ship. The CTD continually records salinity from the surface to depth, and gives a profile of salinity and how it changes throughout the water column. BATS technicians also analyze the salinity of water collected from the CTD once it is back onboard ship. They make this measurement on a salinometer. This machine measures the salt content of the water directly, rather than by measuring the water's conductivity. (Return to top)


